将DataFrame中的数据以表格的形式另存为图片

将DataFrame中的数据以表格的形式另存为图片

在上次按序输出关联矩阵的blog中有了将DataFrame中的数据以表格形式另存储为图片的想法。

起初,Google了在StackOverflow上找到了相关问题,并将代码修改应用于Titanic的数据上,具体如下:

1
2
3
4
5
6
7
8
9
10
from pandas.plotting import  table

fig = plt.figure(figsize=(5, 6))
ax = fig.add_subplot(111, frame_on=False) # no visible frame
ax.xaxis.set_visible(False) # hide the x axis
ax.yaxis.set_visible(False) # hide the y axis

table(ax, train_corr, loc='center') # where df is your data frame

plt.savefig('correlation_matrix_vague.jpg')
This is a vague pic
This is a vague pic

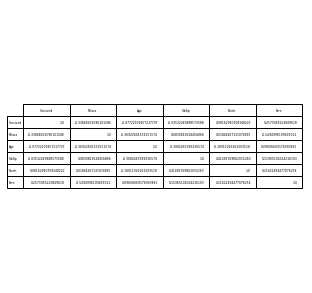
但是,发现另存为的图片极为模糊,再思考并查询相关文档未果后,并在StackOverflow上提出了相关问题,发现是因为没有设置合适的dpi参数,故设置合适的dpi参数并修改代码如下:

1
2
3
4
5
6
7
8
9
10
from pandas.plotting import  table

fig = plt.figure(figsize=(5, 6), dpi=1400)
ax = fig.add_subplot(111, frame_on=False) # no visible frame
ax.xaxis.set_visible(False) # hide the x axis
ax.yaxis.set_visible(False) # hide the y axis

table(ax, train_corr, loc='center') # where df is your data frame

plt.savefig('correlation_matrix_HD.jpg')

Reference

在matplotlib的一个figure中画多个subplots

How to save a pandas DataFrame table as a png

Titanic in Kaggle

How to make picture clear when saving the table of DataFrame as a picture

Relationship between dpi and figure size

pandas.plotting

matplotlib.pyplot.table