在matplotlib的一个figure中画多个subplots

在一个figure中画多个subplots

在做EDA和Data Visualization中常常会用到的一个code snippet,在这里以kaggle上的titianic数据为例子:

1
2
3
4
5
# 先导入packages
import pandas as pd
import matplotlib.pyplot as plt
%matplotlib inline
import seaborn as sns
1
2
3
4
5
6
7
8
9
10
11
12
13
14
15
16
17
18
19
20
# 导入数据
# path需根据具体环境作调节
path = 'input'

train_df = pd.read_csv(''.join([path, '/train.csv']))
test_df = pd.read_csv(''.join([path, '/test.csv']))
gender_sub_df = pd.read_csv(''.join([path, '/gender_submission.csv']))

# 以Survived特征为例子
fig, (ax1, ax2) = plt.subplots(nrows=1, ncols=2)

# ax1
sns.countplot(train_df['Survived'], ax=ax1)

# ax2
# autopct参数是用来显示饼图上百分比的
ax2.pie(train_df['Survived'].value_counts(), autopct='%1.1f%%')
# set_aspect('equal')是为了让饼图成圆形(circle)而不是椭圆(ellipse, oval)
ax2.set_aspect('equal')
plt.set_xlabel('Survived')

其中部分代码也可重写为如下:

1
2
3
4
5
6
7
8
9
fig, ax = plt.subplots(nrows=1, ncols=2)

# ax1
sns.countplot(train_df['Survived'], ax=ax[0])

# ax2
ax[1].pie(train_df['Survived'].value_counts(), autopct='%1.1f%%')
ax[1].set_aspect('equal')
plt.set_xlabel('Survived')

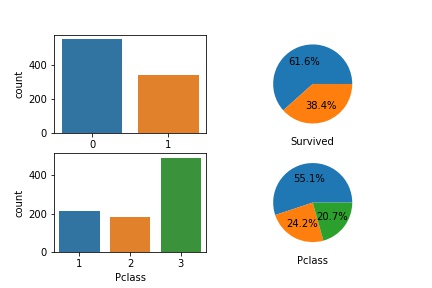
也可以根据修改nrows, ncols参数来适用多行多列的情况:(这里举得这个例子只是为了举例而举例,没有过多实际意义)

1
2
3
4
5
6
7
8
9
10
11
12
13
14
15
16
17
fig, ax = plt.subplots(nrows=2, ncols=2)

# ax[0, 0]
sns.countplot(train_df['Survived'], ax=ax[0, 0])

# ax[0, 1]
ax[0, 1].pie(train_df['Survived'].value_counts(), autopct='%1.1f%%')
ax[0, 1].set_aspect('equal')
ax[0, 1].set_xlabel('Survived')

# ax[1, 0]
sns.countplot(train_df['Pclass'], ax=ax[1, 0])

# ax[1, 1]
ax[1, 1].pie(train_df['Pclass'].value_counts(), autopct='%1.1f%%')
ax[1, 1].set_aspect('equal')
ax[1, 1].set_xlabel('Pclass')
four_subplots_in_one_figure

当然也可以用循环来实现,在此不对这举例了。

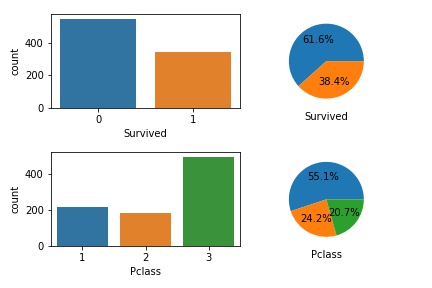
中间还有2个小插曲,就是我实现的时候,发现ax[0, 0]的subplot没有x_label,所以还去StackOverflow上面提了个Question,发现仅仅是被hidden住了,加上一行plt.tight_layer()代码即可。

1
2
3
4
5
6
7
8
9
10
11
12
13
14
15
16
17
18
19
fig, ax = plt.subplots(nrows=2, ncols=2)

# ax[0, 0]
sns.countplot(train_df['Survived'], ax=ax[0, 0])

# ax[0, 1]
ax[0, 1].pie(train_df['Survived'].value_counts(), autopct='%1.1f%%')
ax[0, 1].set_aspect('equal')
ax[0, 1].set_xlabel('Survived')

# ax[1, 0]
sns.countplot(train_df['Pclass'], ax=ax[1, 0])

# ax[1, 1]
ax[1, 1].pie(train_df['Pclass'].value_counts(), autopct='%1.1f%%')
ax[1, 1].set_aspect('equal')
ax[1, 1].set_xlabel('Pclass')

plt.tight_layout(h_pad=1)
four_subplots_in_one_figure_plt_tight_layout

还有就是hexo插图片时,若用markdown语法,说是文章在首页无法显示图片,点进去后仍可,所以只可采用最好用标签插件语法来实现,例如:

Reference

Titanic in Kaggle

why-is-matplotlib-plotting-my-circles-as-ovals

how-to-set-the-labels-size-on-a-pie-chart-in-python

set-xlabel-is-in-invalid-in-ax0-0-when-drawing-4-subplots-in-one-plot

How-to-insert-image-in-hexo-post